Pathway Enrichment Analysis
Pathway Enrichment Analysis
Results from modern omics analyses are often made up of long lists of genes, requiring an impractically large amount of manual literature research to interpret. Pathway enrichment analysis helps researchers gain mechanistic insight into these lists by helping to identify biological pathways that are more enriched in a gene list than what would be expected by chance.
Using the 2019 nature protocols paper by Reimand et al. as inspiration, this tutorial will be split in 4 main sections: definition of a gene list from omics data, determination of statistically enriched pathways, visualization and interpretation of the results and gene overlap testing.1 Note that these principles can be applied to diverse types of omics data.
In this tutorial we will be presenting five different tools. Three for conducting alternative methods of pathway enrichment analysis, one for visualization and network exploration and lastly, one for the testing of overlap between two gene lists. At the time of this being written, these tools are the state-of-the-art, go-to, recommended ones to use for their respective analysis method.
g:Profiler and Enrichr to perform gene enrichment analysis.
GSEA (Gene-set enrichment analysis).
Cytoscape for visualizing the results.
GeneOverlap for testing and visualizing overlaps in gene lists.
1. Definition of a gene list
Gene pathway analysis can be applicable to the analysis of lists of genes or biomolecules from any organism derived from large-scale data, including proteomics, genomics, epigenomics and gene-regulation studies, these data can come from gene expression microarrays, quantitative proteomics, germline and somatic genome sequencing and global DNA methylation assays amongst others. They usually contain the features (genes) as rows and metadata specific to the experiment that generated it as columns, they can be any output list of biological features. For DEG analysis there are usually two kinds of gene lists; ranked and unranked. The difference is trivial, an unranked list is ordered based on a specific parameter, for DEG results this is often the FDR-adjusted p-value or the FC (fold change) sign (+ or -)*-log10(p-value), sometimes this can be the fold change sign only. For an example of this output see the POLvsSAL.csv result file from the STAR comparison described on the Differential Gene Expression Analysis tutorial page.
Examples of unranked lists: All somatically mutated genes in a tumor identified by exome sequencing, or all proteins that interact with a bait in a proteomics experiment.
Examples of ranked list: Output list of genes ranked by p-value of the significance of differential expression, Q-value (a.k.a. adjusted p-value, corrected for multiple testing across all genes), effect size and direction of expression change (upregulated genes are positive and at the top of the list and downregulated genes are negative and at the bottom of the list, often expressed as log-transformed fold-change (logFC). (e.g., −log10 p-value multiplied by the sign of logFC)
N.B.: Lists can also be partial, i.e., containing only outputs filtered by a particular threshold (e.g., FDR-adjusted P value <0.05 and fold-change >2). For an example of this, see the POLvsSAL_UP_DEGs.csv and POLvsSAL_DOWN_DEGs.csv, gene lists. These were filtered
2. Determination of statistically enriched pathways
The statistical detection of pathways or other groups of genes showing an over-representation in the gene list of interest in contrast to what would be expected by chance. Usually performed using Gene Ontology (GO) (biological processes, cellular components and molecular functions) terms or annotations from other databases (e.g., KEGG (everything), Reactome (pathways), TRANSFAC (transcription factors), etc.)
There are two presently used method to conduct enrichment analysis, gene enrichment analysis and gene-set enrichment analysis (GSEA).
2.1. Gene enrichment analysis.
Takes list or partial ranked list as input. The p-value of the enrichment of a pathway is computed using a Fisher’s exact test and multiple-test correction is applied (usually Benjamini‐Hochberg’s method or a custom method). The Fisher’s exact test compares the expected number of significant genes at random to the observed number of significant genes to arrive at a probability. The results are usually computed by referencing to the many databases mentioned above. Multiple software: g:Profiler, DAVID, Enrichr, GOrilla, etc.
In the scope of this tutorial we recommend using two tools for the gene enrichment analysis:
2.1.1. Enrichr
Enrichr is an interesting tool because it hosts and very comprehensive online tool. It also hosts API capabilities for access programmatically. It’s very simple to use, accepts multiple types of gene ids and queries multiple databases. It currently contains a collection of ∼400,000 annotated gene sets organized into ∼300 gene‐set libraries. 2 It also immediately provides the user with tables and different plots that can be used for publications or even easily customized in software such as Adobe Illustrator or the free an open-source Inkscape.
Check the online tool here and the latest publication here.2
2.1.2. g:Profiler
g:Profiler uses very similar calculations as Enrichir, it also has a very user friendly online tool and is also available as an R package with very comprehensive documentation and offers API access. Check out the gProfiler_script.R for an example of how to use it in R. g:Profiler and Enrichr complete each other well because while Enrichr provides quick results and ready made graphs, g:Profiler is much more customizable, accepts all kinds of custom lists (this include background lists, see why this often recommended and often necessary in the 2.4 Background Gene List Generation section of the Differential Gene Expression Analysis page). g:Profiler also supports almost all genomes however, whereas Enrichr only works for a selected few. g:Profiler also supports custom gene set files (GMT (Gene Matrix Transposed file format)). You can find their latest publication here.3
2.2. Gene-set enrichment analysis (GSEA).
In some experiments comparing two conditions, there might not be any genes or only a few genes that are significantly over-represented in pathways or gene sets, but this doesn’t mean that groups of genes aren’t enriched. See the figure below:
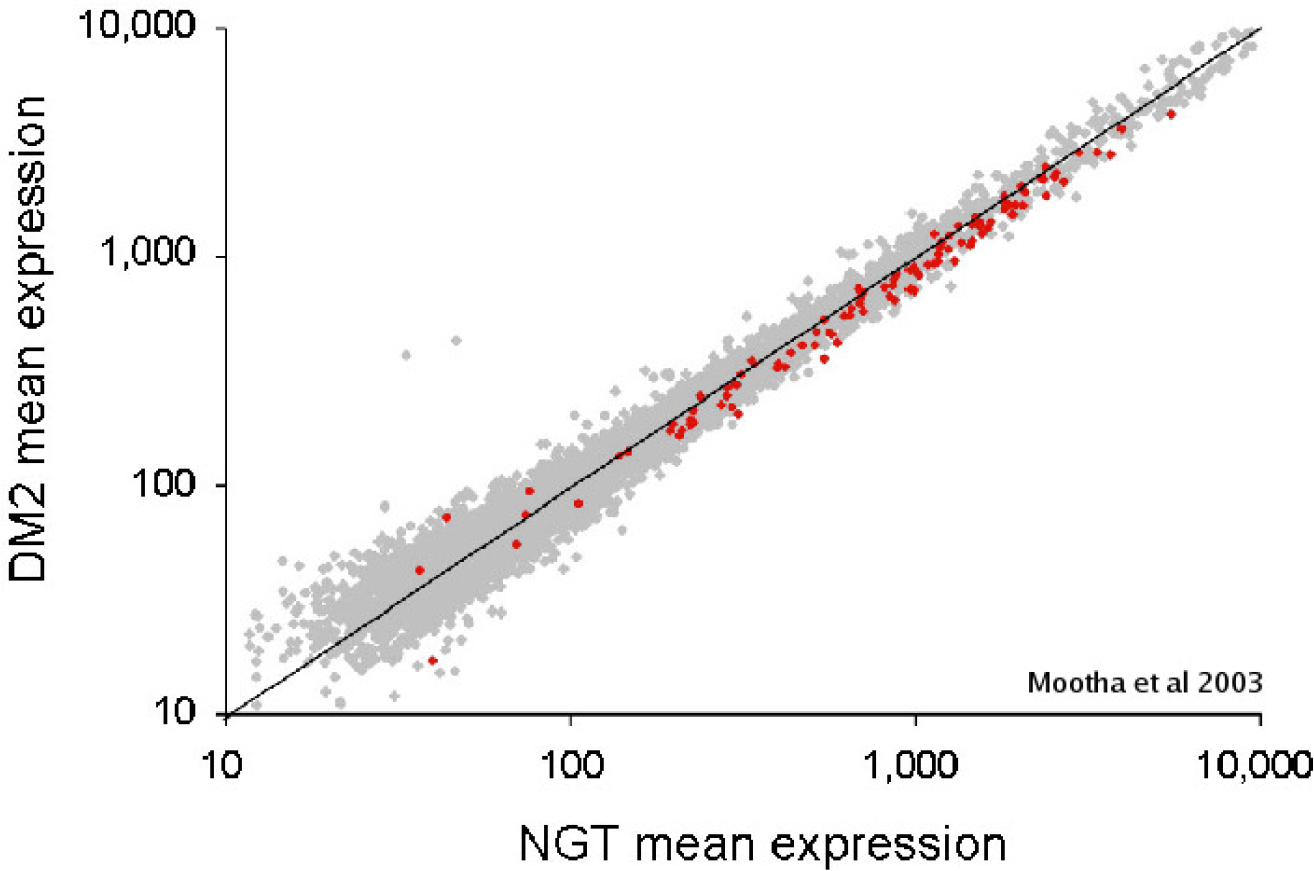
GSEA is a tool developed by the UC San Diego and the Broad Institute to achieve just that. It has been around for longer than the two previous tools. It takes full ranked list as input. It uses the Kolmogorov-Smirnov (KS) test to assign enrichment score (ES) to a group of genes with multiple testing corrections applied. The KS test compares the distribution of gene p-values expected at random to the observed distribution of the gene p-values to arrive at a probability. GSEA is available as standalone desktop software downloadable from their website. It also provides a very comprehensive documentation and it’s very own Molecular Signatures Database (MSigDB), a collection of annotated gene sets for use with GSEA software. Custom annotated gene sets can also be used.
GSEA works by progressively examining genes from the top to the bottom of the ranked list, increasing the ES if a gene is part of the pathway and decreasing the score otherwise. These running sum values are weighted, so that enrichment in the very top- (and bottom-) ranking genes is amplified, whereas enrichment in genes with more moderate ranks are not amplified. The ES score is calculated as the maximum value of the running sum and normalized relative to pathway size, resulting in a normalized enrichment score (NES) that reflects the enrichment of the pathway in the list. It then searches for the MSigDB gene set database, which includes pathways, published gene signatures, microRNA target genes and other gene set types. The user can also provide a custom database. GSEA also allows to search MSigDB for significant pathways also appearing in other experiments.
3. Visualization and interpretation of pathway enrichment analysis results
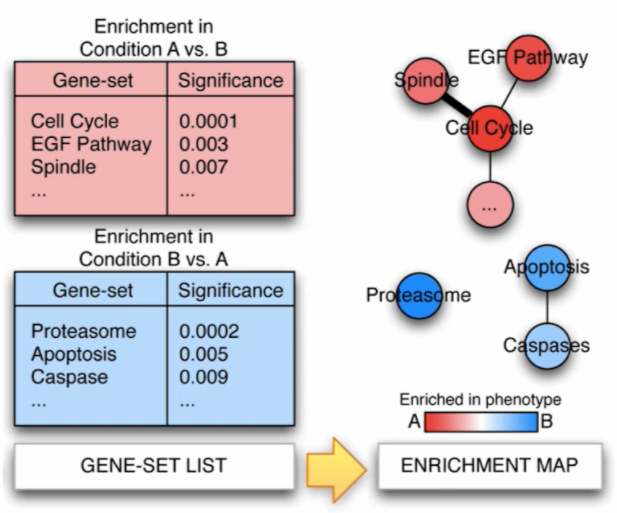
Pathway information is inherently redundant, as genes often participate in multiple pathways, and databases may organize pathways hierarchically by including general and specific pathways with many shared genes (e.g., “cell cycle” and “M-phase of cell cycle”, etc.). Collapsing redundant pathways into a single biological theme simplifies interpretation and visualization. As recommended in the Reimand et al. 2019 paper, Cytoscape is the current state of the art tool to do so. Just as GSEA it comes in a standalone, downloadable, GUI software for use from the desktop but can also be completely used programmatically with scripting languages such as python and R. It allows the visualization of many different types of biological data like gene and other complex networks. For pathway enrichment analysis EnrichmentMap and AutoAnnotate are usually the tools to use. As seen in the Figure bellow, pathways are shown as circles (nodes) that are connected with lines (edges) if the pathways share many genes. Nodes are colored by ES. Edges are sized on the basis of the number of genes shared by the connected pathways. Network layout and clustering algorithms automatically group similar pathways into major biological themes.
Cytoscape’s main website.
4. Gene Overlap Testing
Testing gene overlap can reveal important biological meaning and lead to novel hypothesis. Simply put, it consists in identifying how similar the contents of two lists of genes are. This problem can be formulated as a hypergeometric distribution or a contigency table (which can be solved by Fisher’s exact test). In the case of this study, for example, some of our results were compared to those identified by human post-mortem studies in the HIP of individuals with schizophrenia.4 Li Shen has crafted an excellent R package to perform this analysis nas visualize it’s results called GeneOverlap.
All in all, The advantages of using pathway analysis are that it improves statistical power in two ways; by aggregates counts of all the genes and genomic regions involved in a given cell mechanism, providing a higher number of counts, which makes statistical analyses more reliable and by reducing the dimensionality from tens of thousands of genes or millions of genomic regions (e.g., SNPs) to a much smaller number of “systems” or “pathways”.1
It also simplifies results as the analysis is phrased at the level of familiar concepts such as “cell cycle”. Better for publishing and can help identify potential causal mechanisms and drug targets. Or other types of experiment planning (e.g., identification of novel pathways). It also makes comparing results obtained from related, but different data easier and facilitates integration of diverse data types, such as genomics, transcriptomics and proteomics, which can all be mapped to the same pathways.
Far from being a perfect technique and still consistently undergoing improvements it does come with it’s limitations such as a bias towards pathways in which multiple genes have strong biological signals. Pathways in which activity is controlled by only a few genes or not controlled by gene expression (e.g., by post-translational regulation) will never be observed as enriched. Pathway boundaries tend to be arbitrary, and different databases will disagree about which genes are involved in a given pathway. (Benefits of using multiple databases) Statistical bias toward larger pathways. Multi-functional genes that are highly ranked in the gene list may lead to enrichment of many different pathways, some of which are not relevant to the experiment. Biased toward well-known pathways. Pathway enrichment analysis ignores genes with no pathway annotations, the “dark matter of the genome”. Most enrichment analysis methods make unrealistic assumptions of statistical independence among genes as well as pathways. Some genes may always be co-expressed and some pathways have genes in common.
-
Reimand, J., Isserlin, R., Voisin, V., Kucera, M., Tannus-Lopes, C., Rostamianfar, A., … & Bader, G. D. (2019). Pathway enrichment analysis and visualization of omics data using g: Profiler, GSEA, Cytoscape and EnrichmentMap. Nature protocols, 14(2), 482-517. ↩ ↩2
-
Xie, Z., Bailey, A., Kuleshov, M. V., Clarke, D. J., Evangelista, J. E., Jenkins, S. L., … & Ma’ayan, A. (2021). Gene Set Knowledge Discovery with Enrichr. Current Protocols, 1(3), e90. ↩ ↩2
-
Raudvere, U., Kolberg, L., Kuzmin, I., Arak, T., Adler, P., Peterson, H., & Vilo, J. (2019). g: Profiler: a web server for functional enrichment analysis and conversions of gene lists (2019 update). Nucleic acids research, 47(W1), W191-W198. ↩
-
Guma, E., do Couto Bordignon, P., Devenyi, G. A., Gallino, D., Anastassiadis, C., Cvetkovska, V., … & Chakravarty, M. M. (2021). Early or late gestational exposure to maternal immune activation alters neurodevelopmental trajectories in mice: an integrated neuroimaging, behavioural, and transcriptional study. Biological Psychiatry. ↩